
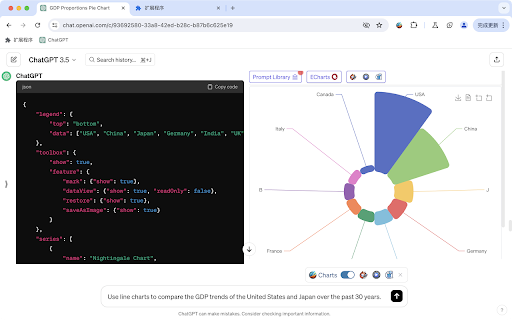
ECharts is a powerful, free charting and visualization library that gives you a wide array of chart types to choose from, including line, bar, pie, scatter, map, and more. Whether you are tracking trends, comparing categories, or exploring geographic patterns, there is a chart ready for the job.
Designed to be highly customizable and interactive, ECharts makes it easy to create dynamic, engaging data visualizations for web applications, dashboards, and reports. You can build charts through declarative configuration or imperative programming, so developers can tailor every detail to their specific needs and workflows.
To make data exploration effortless, ECharts also provides features like data zooming, tooltips, and visual encoding. These built-in tools help users dig deeper into the numbers, spot patterns faster, and truly understand what their data is telling them.
Subscribe to get the latest ECharts Data Visualization and global AI updates.


Comments
Loading comments…