
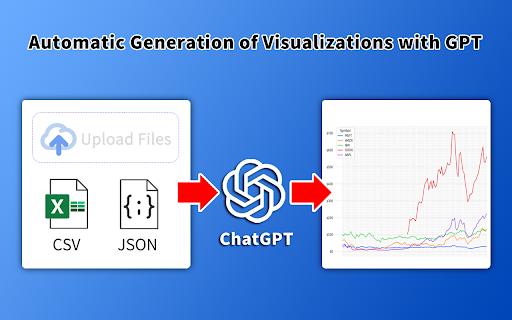
GPT Spreadsheets Visualization is a tool for generating data visualizations and data-faithful infographics. Instead of wrestling with chart syntax yourself, you can lean on the language modeling and code writing capabilities of state-of-the-art LLMs to turn your data into visuals with minimal effort.
The tool works with any programming language and visualization libraries, such as matplotlib, seaborn, altair, d3, and more. It also supports multiple large language model providers, including ChatGPT, PaLM, Cohere, and Huggingface, so you can choose the model that fits your workflow.
It comprises four modules: a SUMMARIZER, a GOAL EXPLORER, a VISGENERATOR, and an INFOGRAPHER. Together, they enable core automated visualization capabilities, including data summarization, goal exploration, visualization generation, and infographics generation.
Beyond creating new visuals, it also supports operations on existing visualizations, such as visualization explanation, self-evaluation, automatic repair, and recommendation, making it easier to understand, refine, and improve the charts you already have.
Subscribe to get the latest GPT Spreadsheets Visualization and global AI updates.


Comments
Loading comments…